🧪 Process Management & Resource Control Lab
📌 Objective
Simulate and troubleshoot a real-world system slowdown caused by CPU saturation and memory exhaustion.
⚙️ Environment
- Virtualization: VirtualBox
- OS: Ubuntu Server
🛠️ Lab Setup
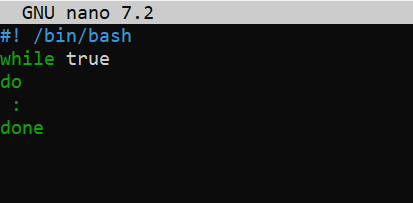
Step 1 - Create CPU Load Script
nano cpu_hog.sh
chmod +x cpu_hog.sh
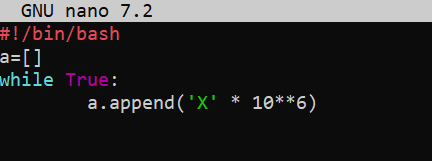
Step 2 - Create Memory Load Script (Python)
nano mem_hog.py
chmod +x mem_hog.py
🚨 Incident Simulation
Step 1 - Check the System Load Baseline
uptime

Step 2 - Run the scripts
./cpu_hog.sh &
python3 mem_hog.py &
🔍 Investigation
Step 1 - Check System Load
``bash uptime

---
### Step 2 - Monitor Processes
```bash
htop

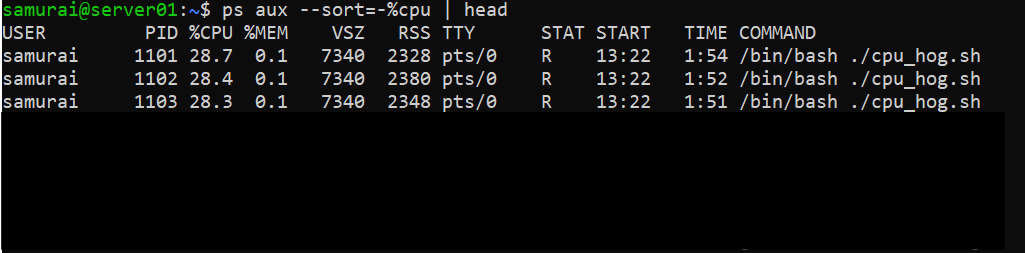
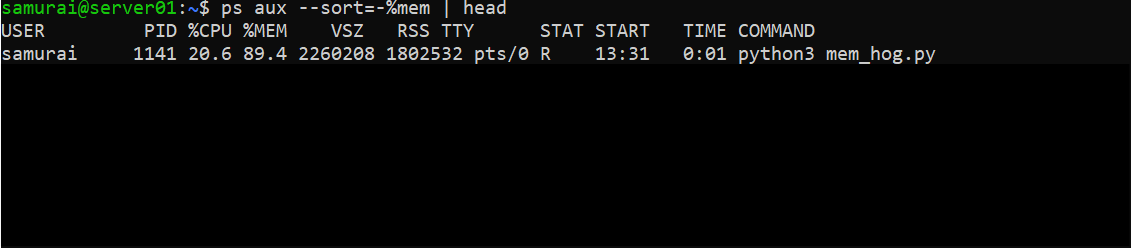
Step 3 - Identify Top Resource Consumers
ps aux --sort=-%cpu | head
ps aux --sort=-%mem | head
🧠 Analysis
System State
- CPU: Fully saturated by multiple cpu_hog.sh processes
- Memory: Exhausted due to mem_hog.py
- Swap: Fully utilized (~2GB)
- Kernel Action: OOM killer terminates mem_hog.py

Key Observations*
- CPU saturation causes system lag
- Memory exhaustion triggers OOM killer
- High swap usage leads to severe performance degradation
- Multiple processes contribute to system overload
✅ Remediation
Step 1 - Kill CPU-Intensive Processes
kill cpu-hog.sh
Step 2 - Verify Memory Status
free -h

Step 3 - Confirm Recovery
uptime
htop


🧪 Experiment (Level 1) - Make the problem less obvious
🛠️ Setup (Disguise the process)
mv cpu_hog.sh systemd-helper

./systemd-helper &
🔎 Investigation
Step 1 - Check System Load
uptime

Step 2 - Monitor Processes
htop

Conclusion: The system slowdown is caused by a CPU-bound workload, not memory pressure.
Step 3 - What is this process
ps aux | grep systemd-helper
which systemd-helper
ls -l /proc/<PID>/exe
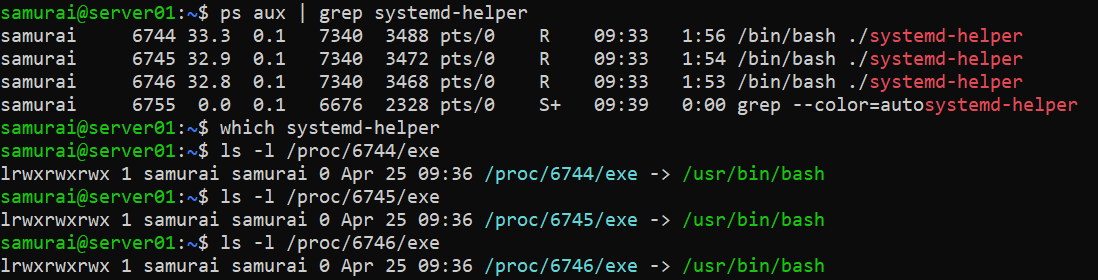
Conclusion: The process is a shell script executed via bash, not a compiled system binary. The process is not installed system-wide and is not part of standard system tools. The process is running through the bash interpreter, confirming it is a script, not a native executable.
Step 4 - Who is running it
ps -o user,pid,cmd -p <PID>

Conclusion: The script is executed from a local directory (./), which is atypical for legitimate system services.
Step 5 - What is the command exactly
ps -fp <PID>

Step 6 - Check parent process
pstree -p <PID>
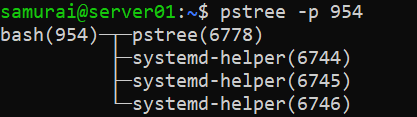
Conclusion: The process is a child of a bash shell, meaning it was launched from an interactive or script-based shell session, not by a system manager like systemd
🧠 Final Summary
- CPU is fully saturated → confirms system slowdown source
- Process is a bash script, not a system binary
- Not found in system PATH → not an installed service
- Executed from local directory → suspicious / non-standard
- Parent service (bash) → not part of system infrastructure
🧾 Final Diagnosis
The system slowdown is caused by a manually executed shell script (systemd-helper) consuming excessive CPU. The process is not a legitimate system service and operates outside standard system management.
⚖️ Final Decision
The process is safe to terminate, as it is:
- Non-critical
- User-executed
- Resource-intensive
- Directly responsible for system degradation
🧪 Experiment (Level 2) - Persistent Process
🛠️ Setup (Persistant process)
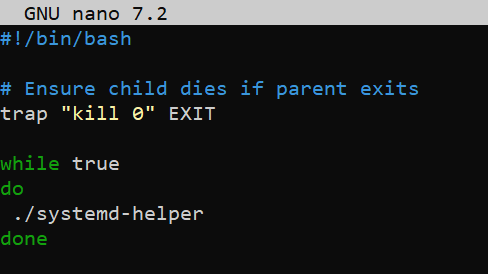
nano restart_cpu.sh

./restart_cpu.sh &
🔎 Investigation
Step 1 - Check System Load
uptime

Step 2 - Monitor Processes
htop

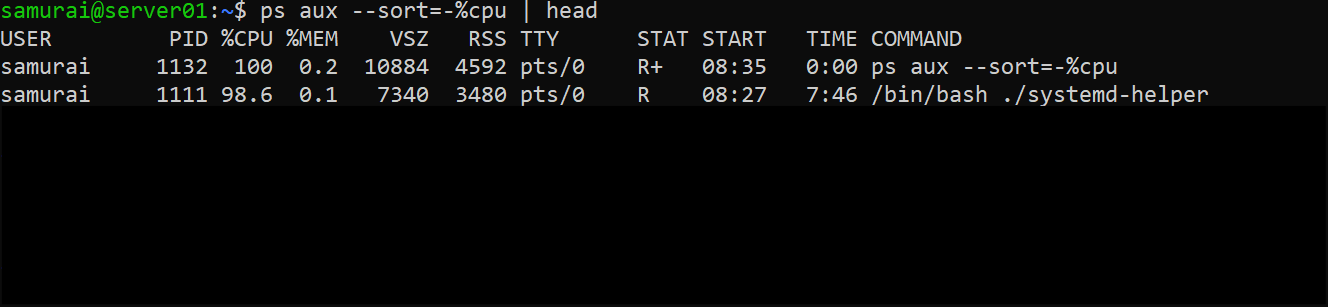
Conclusion: The system slowdown is caused by a CPU-bound workload.
Step 3 - Identify top process
ps aux --sort=-%cpu | head
Step 4 - Inspect process details
ps -fp <PID>

Step 5 - Verify process legitimacy
ls -l /proc/<PID>/exe

Conclusion: The process is a shell script executed via bash, not a compiled system binary. The process is not installed system-wide and is not part of standard system tools. The process is running through the bash interpreter, confirming it is a script, not a native executable.
Step 6 - Analyze process hierarchy
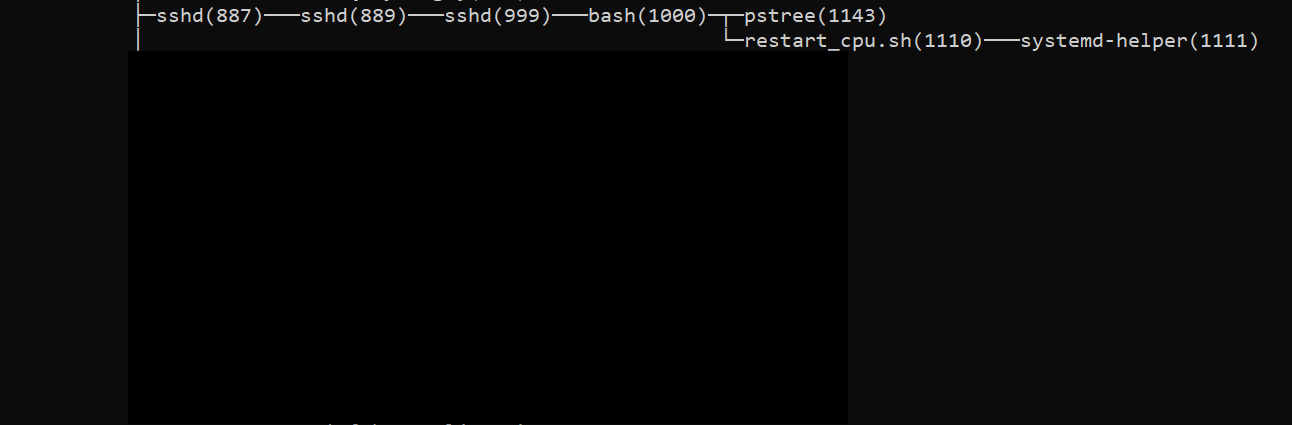
pstree -p
Step 7 - Test process behavior
kill <child_PID>
Conclusion: The process (./systemd-helper) is being respawned (persistent)

Step 8 - Identify root cause
ps -fp <parent_PID>

Conclusion: The script (restart_cpu.sh) is responsible for restarting child. The parent process (./restart_cpu.sh) is the true source of persistence
✅ Remediation
Step 1 - Kill parent process
kill <parent PID>
Expected outcome:
- Child process stops
- CPU usage drops


🧪 Experiment (Level 3) - Misleading Signal: Disk I/O Noise
🛠️ Setup (Misleading signal)
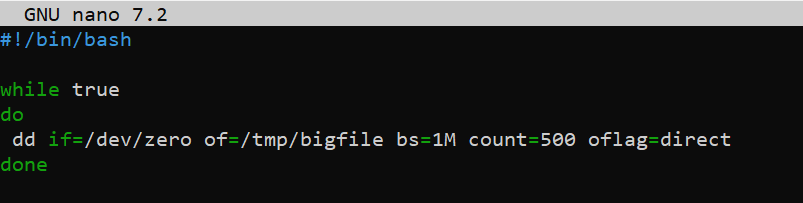
nano disk_worker
chmod +x disk_worker
Run:
./disk_worker > /dev/null 2>&1 &
./restart_cpu.sh > /dev/null 2>&1 &
🔎 Investigation
Step 1 - Check System Load
uptime

Observation Load average is elevated
Conclusion: System is under load and requires investigation
Step 2 - Monitor Processes
htop

Observation
- ./systemd-helper ≈ 100% CPU
- dd ≈ ~0.8% CPU
- Memory usage stable (~161MB/2GB)
Conclusion: CPU saturation is dominated by a single process (systemd-helper). Disk-related processes (dd) exist but contribute minimal CPU usage. Initial-signal: CPU-bound issue
Step 3 - Cross-check top CPU consumers
ps aux --sort=-%cpu | head

Observation
- ./systemd-helper ≈ 88% CPU
- dd ≈ ~20% CPU
Conclusion: CPU usage confirms:
- systemd-helper is a consistent high consumer
- dd contributes CPU intermittently (burst behavior)
Step 4 - Check disk activity
iotop-c

Observation
- Multiple dd processes appear
- I/O usage visibly active (graph column moving)
Conclusion: Disk I/O is actively being generated, primarily by dd. However, presence of activity ≠ proof of bottleneck.
Step 5 - Detect process behavior pattern
pgrep -a dd

Observation
- Multiple PIDs for dd
- Processes appear and disappear rapidly
Conclusion: dd is a short-lived worker process, likely spawned in a loop. It’s not a stable root process -> must trace parent
Step 6: Trace process origin
Method A - Real time capture
watch -n 0.5 "ps -o pid,ppid,cmd -C dd"

Method B - Process tree
pstree -p | grep dd

Method C - Manual tracing
ps -fp <PPID>

Observation
- dd processes originate from a parent script (disk-worker)
Conclusion: dd is a child process, not root cause. A controller script is responsible for generating disk load.
🧠 Interim Analysis
Signals observed:
- CPU -> heavily saturated by systemd-helper
- Disk -> active due to dd
- Memory -> stable
Interpretation: CPU load is continuous and dominant Disk activity is real but secondary/bursty
🎯 Hypothesis
H1 - CPU is the primary bottleneck
System slowdown is caused by systemd-helper
H2 - Disk I/O is the primary bottleneck
System slowdown is caused by dd activity
Test Disk Hypothesis (H2)
kill <disk_worker PID>
Observation
- dd processes disappear
- Disk activity drops
- systemd-helper still consuming ~ 100% CPU
- System remains slow
Conclusion: Disk I/O is not the primary cause, it’s a secondary signal (noise)
Test CPU Hypothesis (H1)
pstree -p | grep systemd-helper
kill <restart_cpu.sh PID>

Observation
- systemd-helper disappears
- CPU usage drops significantly
- System responsiveness improves immediately

Conclusion: CPU saturation is the PRIMARY cause. systemd-helper is the root problem.
🧠 Final Diagnosis
- Primary cause -> CPU saturation (systemd-helper)
- Secondary noise -> Disk I/O (dd via disk-worker)
Debugging Workflow
- Detect system stress (uptime)
- Identify dominant resource (htop)
- Cross-check processes (ps)
- Identify process behavior (stable vs bursty)
- Trace parent processes (pstree / watch)
- Form hypothesis
- Test by removing one factor at a time
- Observe system response
- Confirm root cause
🧪 Experiment (Level 4) - Delayed Failure
🛠️ Setup (Delayed Failure)
- Create delayed CPU worker
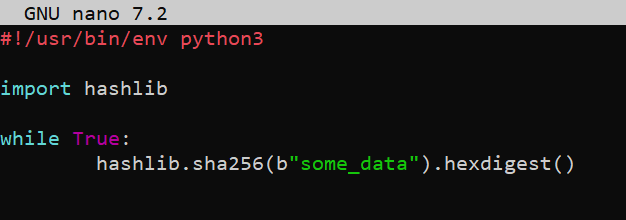
nano analytics_worker.py
chmod +x analytics_worker.py
- Create delayed launcher
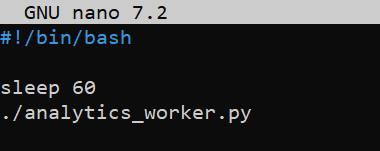
nano delayed_start.sh
chmod +x delayed_start.sh
./delayed_start.sh > /dev/null 2>&1 &
🧠 Phase 1 — Initial State
htop
ps aux --sort=-%cpu | head

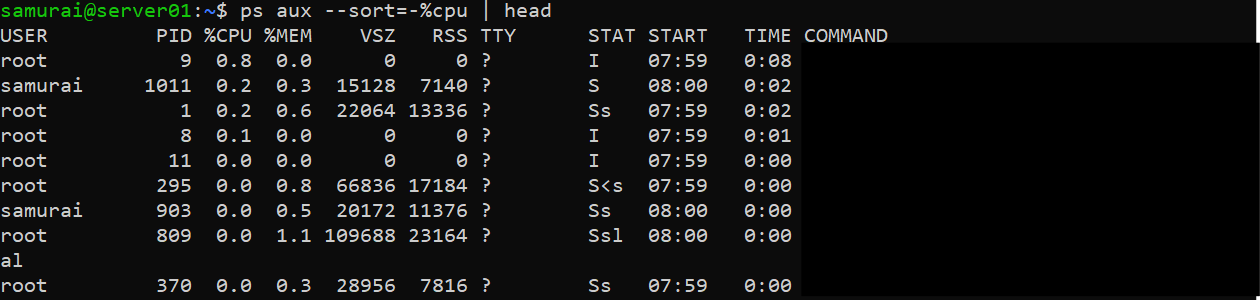
Observation
- System is responsive
- CPU normal
- No obvious suspicious processes
Conclusion:
- No immediate issue detected
- System appears healthy
⏱️ Phase 2 — Degradation State
htop
ps aux --sort=-%cpu | head
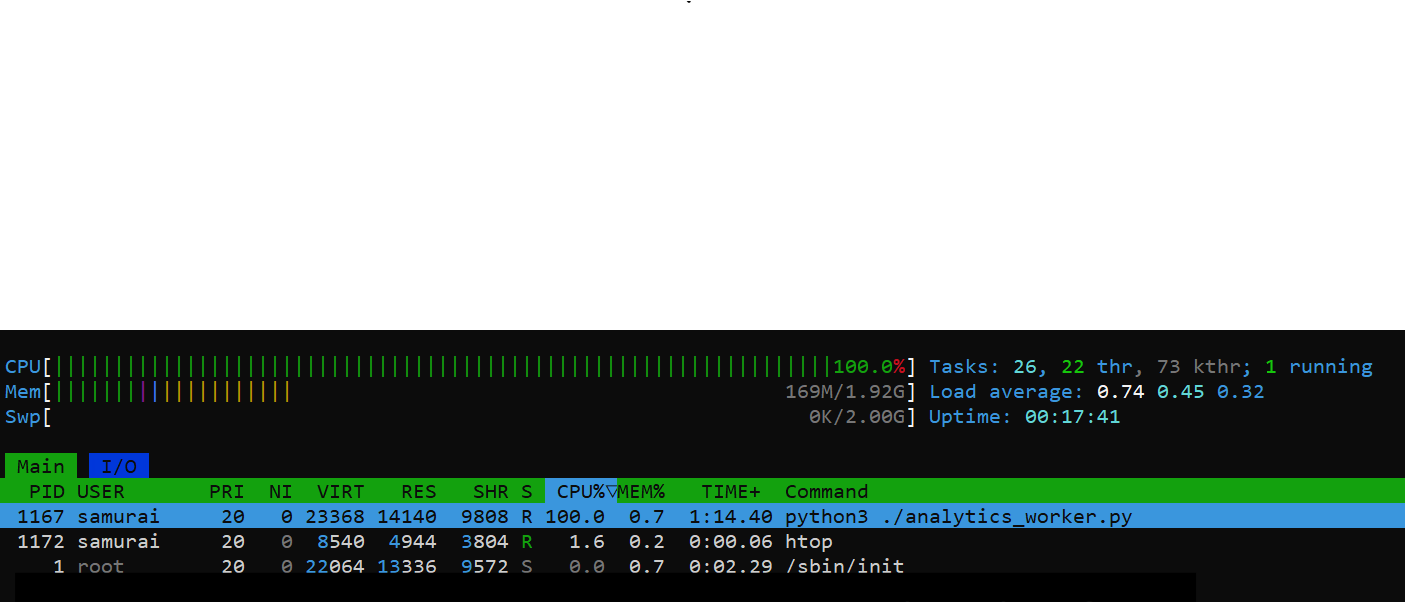
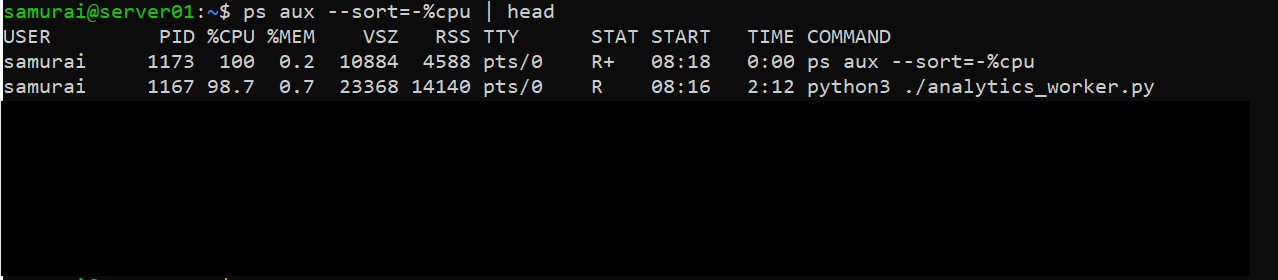
Observation
- analytics_worker.py now consuming ~100% CPU
Conclusion:
- Issue is time-triggered, not constant
- Requires correlation with recent activity
🔎 Investigation
Step 1 - Identify new processes
ps -eo pid,lstart,cmd --sort=start_time | tail
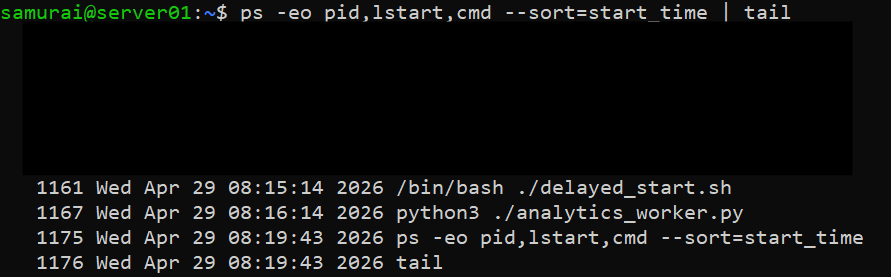
Observation
- analytics_worker.py started recently
Conclusion: Newly started process correlates with system degradation
Step 2 - Trace origin
ps -fp <PID>
pstree -p
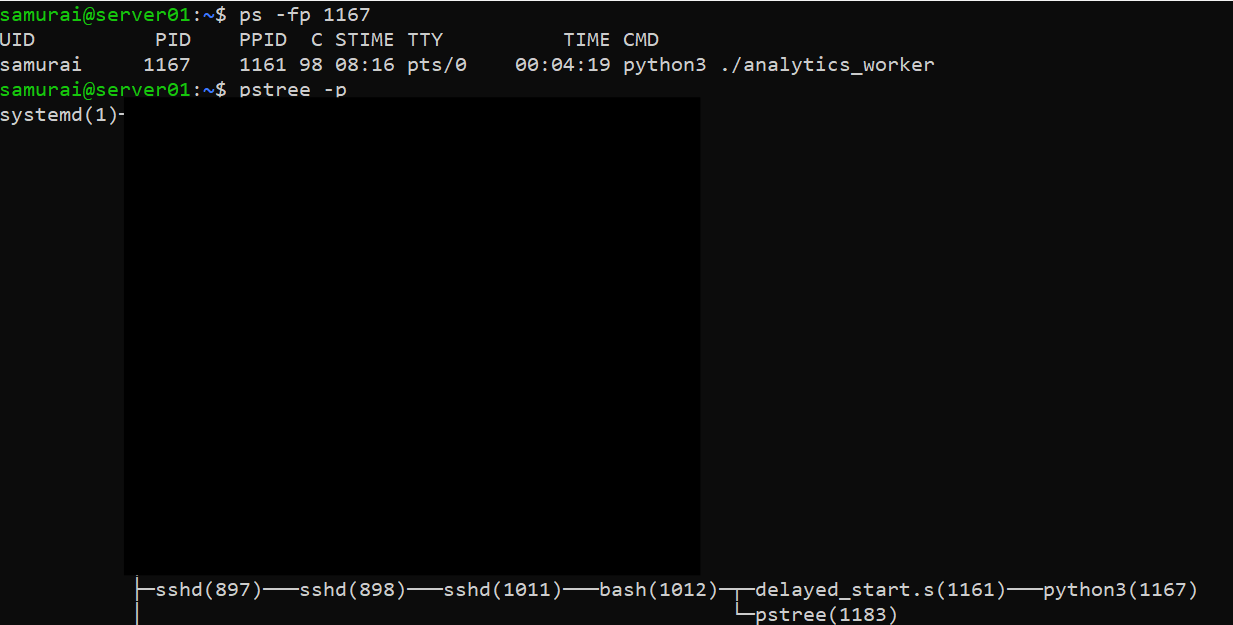
Observation
- Parent process (delayed_start.sh)
Conclusion: Root cause is delayed execution script, not just the worker
✅ Remediation
Kill either child or parent process
kill <analytics_worker PID>
kill <delayed_start.sh PID>

🧪 Experiment (Level 5) - Resource Prioritization
📌 Objective
To understand how Linux CPU scheduling priority affects process behavior under load.
⚙️ Setup
Step 1 - Start normal priority CPU process (baseline)
./systemd-helper &
Default priority: Normal CPU scheduling priority (0)
Step 2 - Start low-priority CPU process
nice -n 15 ./systemd-helper &
Meaning:
- nice 15 = lower priority than default
- scheduler deprioritizes this process under load
🔍 Investigation
Step 1 - Observe CPU behavior
htop

Observation
- Process (NI = 0) -> ~100% CPU
- Process (NI = 15) -> ~5% CPU
Conclusion: Under CPU saturation, the scheduler allocates significantly more CPU time to the process with lower nice value (higher scheduling priority).
Step 2 - Inspect process priority
ps -o pid,ni,pri,cmd -C systemd-helper

Observation
- NI = 0 -> PRI ≈ 19
- NI = 15 -> PRI ≈ 4
Conclusion: ps PRI represents the kernel’s internal scheduling priority, which is dynamically derived from the niceness value. It is not directly comparable to htop PR, which uses a simplified user-level mapping (PR ≈ 20 + NI)
Step 3 - Apply system stress
Start additional load:
./systemd-helper &

Observation
- with increased load, CPU competition becomes more visible
- NI = 0 processes consistently dominate CPU usage
- NI = 15 process receives significantly fewer CPU time slices
Concluion: Under high system contention, the scheduler enforces priority dofferences more aggressively, making niceness effects clearly observable.
Step 4 - Validate CPU distribution
ps -eo pid,ni,pri,pcpu,cmd | grep systemd-helper

Observation
- NI = 0 processes -> higher %CPU
- NI = 15 process -> significantly lower %CPU
Conclusion: CPU usage distribution confirms scheduler bias: lower nice values receive more CPU time under load, and this difference becomes measurable over time.
🧠 Final Insight
- htop shows real-time CPU distribution
- ps PRI shows kernel scheduling priority
- nice only influences CPU scheduling weight, not execution capability
- Differences become visible only under CPU contention